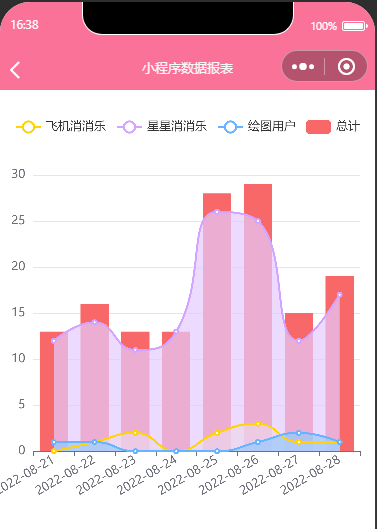
一、下载插件:https://github.com/ecomfe/echarts-for-weixin
将下载的ec-canvas文件放置到小程序项目根目录
二、引入插件:打开.json文件
{
  "usingComponents": {
    "ec-canvas": "../../ec-canvas/ec-canvas"
  },
  "navigationBarTitleText": "小程序数据报表"
}三、设置echarts样式:打开/wxss文件,加入如下代码:
/**index.wxss**/
.container {
  position: absolute;
  top: 0;
  bottom: 0;
  left: 0;
  right: 0;

  display: flex;
  flex-direction: column;
  align-items: center;
  justify-content: space-between;
  box-sizing: border-box;
}
ec-canvas {
  width: 100%;
  height: 800rpx;
  margin-top: 50rpx;
  background-color: #fff;
}四、使用echarts:打开.js文件,加入如下代码
import * as echarts from '../../ec-canvas/echarts';

const app = getApp();
var result = [];
function initChart(canvas, width, height, dpr) {
  const chart = echarts.init(canvas, null, {
    width: width,
    height: height,
    devicePixelRatio: dpr // new
  });
  canvas.setChart(chart);

  var option = {
     tooltip: {
       trigger: 'axis'
     },
     legend: {
       data: ['飞机消消乐','星星消消乐','绘图用户','总计']
     },
     grid: {
       left: '3%',
       right: '4%',
       bottom: '3%',
       containLabel: true
     },
     // 自动滚动

     dataZoom: {
      type: 'inside',     // inside: 表示用内测滑块
      startValue: 0,     // 开始显示的数
      endValue: 7,       // 结束显示的数
      xAxisIndex: [0],    // 代表是作用在y轴上的
      // start: '0',
      // end: '1',
      // zoomLock: true,
      zoomOnMouseWheel: false,  // 关闭滚轮缩放
      moveOnMouseWheel: true, // 开启滚轮平移
      moveOnMouseMove: true  // 鼠标移动能触发数据窗口平移

    },
     xAxis: {
       type: 'category',
       axisLabel: {
        interval:0,
        rotate:30
      },
       data: result.countGameVip.countGameVipDate

     },
     yAxis: {
       type: 'value'
     },
     series: [
       {

         name: '飞机消消乐',
         type: 'line',
         // stack: 'Total',
         data:  result.countGameVip.countGameVipNum,
         itemStyle : {
             color:'#FFD306'
         },
         smooth:true,
         areaStyle: {
           color:'#FFF4C1',
         }
       },
       {
         name: '星星消消乐',
         type: 'line',
         // stack: 'Total',
         data:  result.countXingGameVip.countXingGameVipNum,
         itemStyle : {
             color:'#d3a4ff'
         },
         smooth:true,
         areaStyle: {
           color:'#E6CAFF',
         }
       },
       {
         name: '绘图用户',
         type: 'line',
         // stack: 'Total',
         data: result.countWxVip.countWxVipNum,
         itemStyle : {
             normal : {
                  color:'#66B3FF',
             }
         },
         smooth:true,
         areaStyle: {
           color:'#97CBFF',
         }
       },
       {
         name: '总计',
         type: 'bar',
         stack: 'Total',
         data: result.countAll,
         itemStyle : {
             normal : {
                  color:'#f96868',
             }
         },
         // barWidth: 20,
       },
     ],
};

  chart.setOption(option);
  return chart;
}

Page({
  data: {
    ec: {
      onInit: initChart
    },
    result:[],
  },

  onReady() {
  },
  onLoad(){
       //请求接口数据
    var that = this
    wx.request({
      url: app.AppUrl + '/wx/getEchart',
      success: function (res) {
        console.log(res.data.result)
        result = res.data.result
      }
    })

  },
  onShow(){
    this.onLoad();
  }
});
五、效果展示:


 关于简忆
关于简忆 简忆诞生的故事


 粤ICP备16092285号
文章评论(0)